Computer Technician Experience

My time at the City of Corona as a Help Desk Technician and a CompTIA A+ certification has been a good foundation for my computer technician experience. Furthermore, I have worked with a variety of computer systems and software. I have experience with hardware installation, troubleshooting, and repair, as well as software installation, configuration, and updating. I have worked with operating systems like Windows and MacOS, as well as software such as Microsoft Office and Adobe Creative Suite. In addition, I have experience in network configuration and troubleshooting, having set up and maintained local area networks. Overall, my problem-solving and customer service skills and has prepared me for a career in IT support.

Data Analyst Experience

In my data analytics experience, I have worked with data sets from various industries. I have experience with data cleaning, data visualization, and statistical analysis using tools such as Excel, SQL, and Python. I have also worked with machine learning algorithms, such as decision trees and regression analysis, to build predictive models. In addition, I have experience with data reporting and presentation, having created dashboards and reports for managers and coworkers. My data analytics experience has allowed me to develop my analytical and problem-solving skills and has prepared me for a career in data science.

Coding Experience

Throughout my college courses, I gained experience in programming languages such as Python, C++, and SQL. I took coursework in data structures, algorithms, and software engineering, which helped me develop my problem-solving and collaboration skills. Outside of college, I worked on several personal projects that are listed below, and a website using Visual Studio Code. These projects allowed me to explore my interests and learn new programming languages and tools. Overall, these experiences have built a strong foundation in coding and have prepared me for a career in these fields.

Project List

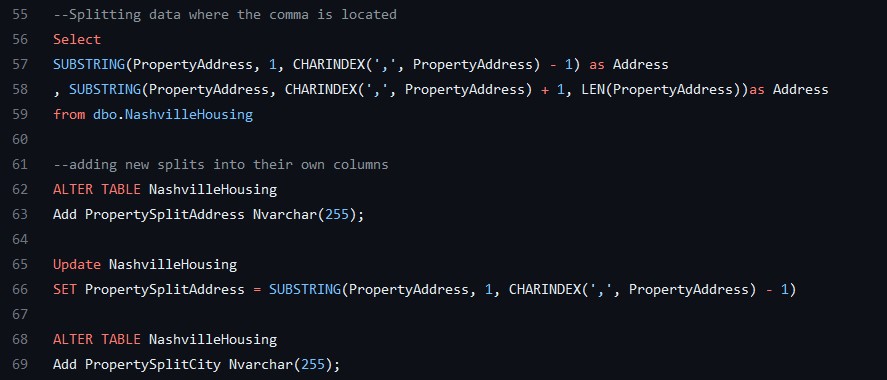
SQL Data Exploration

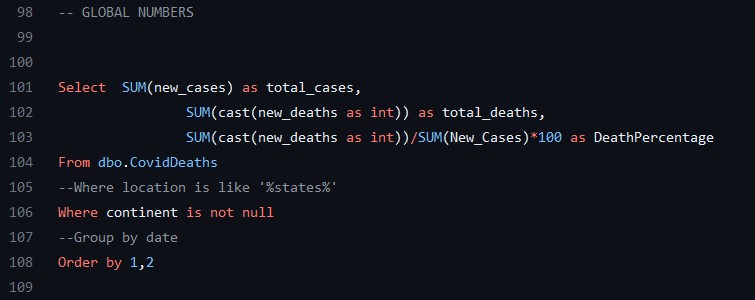
Here is the code that I wrote to explore data I found on the Covid-19 pandemic. I used join functions and converted data types to efficiently query the data. I used aggregate functions to examine the statistical significance in each area of the data. I used window functions and temp tables to present the return data in an significant manner. I finished by examining different contents and got outputs that we could compare data from different areas.

View Project

Data Visualization with Tabaeu

In this project, I took the data from Covid-19 and created a dashboard included various graphs,charts, and maps to interpret it. I created a bar and pie charge to visualy represent the total death numbers by continent. The map is an interactive heatmap of infections per country, followed by a line graph that is a timeline representation of the percent in population that got infected in each country.

View Project

Data Cleaning with SQL

After downloading raw data about the housing market in Nashville, Tenessee, I used SQL to produce clean and useful data that we could use to find significant information. I standardized certain data like the dates and address fields which included breaking up the address fields for better filtering and querying. I cleaned out some data by removed duplicates and deleted data that was deemed insignificant information.

View Project

Correlation with Python

This project looks at movies and tests what factors we can find correlation between. We start with cleaning the data by deleting any null values and deleting redundencies. After sorting movies by highest gross earnings, we create a couple plot graph showing the gross earnings with the movie's budgets and critic scores. This follows with a correlation matrix between all fields of our data, and this allows us to look at what fields have the highest correlations. The project ends with code breaking down the highest contributors to those high grossing movies.

View Project